Tuesday, September 11, 2012

Is there a way to suppress errors from perfmon counters in controller

Problem Statement: During our day to day life as performance testers / experts, we must have noticed a lot of errors related to counters during a long running scenario. Mostly the errors are like "A counter with a negative denominator value was detected.", "A counter with a negative time base value was detected." or "A counter with a negative value was detected."

All these errors make the online monitoring a lot difficult to filter out the actual errors coming from the application.

Is there a way to mask these errors related to counters?

SolutionThe answer is Yes, it is possible to do so.
For this you need to do the below change in both Controller and Load Generator machine.


  • Go to the Loadrunner (or performance center host) installation dir; then go to folder "dat -> monitors" 
  • under that folder open the file "nt.cfg" in a wordpad; it will be like as shown in the snapshot below:


  • You can see the "general" section in the file, there is an entry called as "FilterErrors" which has the current value as 6.
  • Now to set the proper value for other errors which you want to suppress, get the Hexa value of the error from MSDN website: " http://msdn.microsoft.com/en-us/library/aa373046(v=VS.85).aspx "
  • Look for the hexa code like " 0x800007D6 (PDH_CALC_NEGATIVE_DENOMINATOR) " for the error " A counter with a negative denominator value was detected. "
  • Open Calculator in scientific mode (in case of XP / win 2003 machine) or programmer mode (in case of win 7 or 2008 server) as shown below


  • Move it to Hex mode and make the entry for the Hex code as it appears for the particular error, in this example it will be "800007D6". Once entered, change the calculator to Dec mode and you will get a number like "2147485654" (see the screenshot below):

  • Copy the value from the calculator and put it in the "nt.cfg" file along with the earlier value separated by comma (,) as shown in the screenshot below:

  • Once done you can perform similar steps for other error types you are getting from windows perfmon counters.
  • Save the "nt.cfg" file and restart the loadrunner agent process (or service) on Load generator.


Monday, September 10, 2012

Functions not allowed while running vusers over firewall

Problem Statement: In certain cases your VUGen script has certain functions (may be custom functions in C like malloc, etc) which runs fine during replay on your machine. But the same function gives an error while running the script on a load generator over firewall (i.e. the vuser is running over a firewall). The error given by LR is: "Error: -19886: CCI security error:You are running under secure mode and the function is not allowed in this mode"

Is there a way to allow the function to be run in the load generator?

PS: This error doesn't come while running the script on a normal load generator (not behind the firewall).


Solution: The answer is Yes, it is possible to do so. 
go to the load generator machine where the above mentioned error is coming; go to the installation directory and open the folder called as "merc_asl".

There will be many "*.asl" files, each corresponding to protocols support during running Vusers over firewall. 

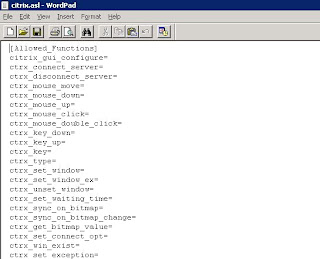
Open the .asl file for the protocol in a wordpad for which you are getting the above error, add your function in that file as shown below:
[Function name]= 
below the [Allowed_Functions] tag


Once you have added the custom function in the asl file; restart the agent service (or process) on the load generator and your script should pass now.

Hope this helps in resolving your issues.

How to create web scripts with different recording option without recording

Problem Statement: In certain cases during recording of a web application we notice that certain actions (or request) are not captured by LR script. Then we are advised to try out in different recording mode and see if we are able to capture the request. 

Is there a way to recreate the script with different recording options without re-recording the business flow again?

Solution: The answer is Yes, it is possible to do so. There is feature in VUGen known as "re generate script" which can be leveraged to get the desired script.

Note: This action will reset all customization done on the saved script (like custom formatting, checks, transaction naming etc)

In this solution which i tried out, i had recorded the application (AUT) in web click and script in a multi-protocol mode. Following the below steps, i had converted the "web click and script" to normal web HTML script.
Once the script is generated, you need to save the script locally and then click on Tools Menu on Vugen and select Regenerate script:


Once you click that option, you will notice a small window with warning message, click on the options button:


After clicking the options menu, you will get the recording option window; select the appropriate recording mode / options you want the script to be generated with and click on OK:


Click on OK on the previous window after the recording option window closes and you can see the VUGen code being re-generated:

Save the script once the code generation is complete.

Thursday, August 30, 2012

How to set authentication object for web services

Problem Statement: In certain cases where the application under test (AUT) is a smart client application and the application uses web-services for it's operations. During recording of the application VUGen doesn't record the authentication object and while replaying the script you get the below error for the web services request(s):


An Authentication object was not found in the SecurityContext
The reason for the SOAP fault is: "An Authentication object was not found in the SecurityContext"

Solution: As mentioned above, the application being a smart client is mostly launched via a web-link where the run time jars / dlls are downloaded locally and application is launched. During launching itself the application takes the credentials from local system (your AD account details) and authenticates the user.

In case of replaying this operation in VUGen this authentication information is not available; this can be done by sending the authentication information in the header before the first web-service request as shown below:


Otherwise if your web service method has property for sending authentication object then you can do so in the request itself.

Hope this helps in solving your issue.

Wednesday, August 29, 2012

How to set CITRIX client file security for Load Generator

Problem Statement: During scenario execution, there might be a step where the citrix session will be interacting with local drive for some operations like select a local file to upload. In this case the citrix session on the load generator will be stuck up due to CITRIX client file security dialog. 

Solution: While doing any operations to access local system resources CITRIX gives a pop-up to user to whether to allow the access or not and settings for it (as shown below in the screenshot):


mostly in our session we choose "Full Access / Read Access" and "Never ask me again". So while we replay our scripts on our local machines it runs fine; but this can cause an issue while running a scenario through a load injector (or load generator).

If you are running the scenario through local injector (localhost) then you can manually do the setting while performing the same operation on the application.

If you are running the scenario on a remote injector then you need to login to that injector machine (as admin) and again perform the same operation and provide access to the citrix client (assuming that the injector is running magentproc under your id).

In case of performance center this thing is a bit tricky; in this case what you need to do is to login to the injector machine (as admin) and open the following location:

"(root directory)\Documents and Settings\(username)\Application Data\ICAClient" and open the webica.ini file in a notepad.

by default there will not be any entries in this file, you need to make the following entry after the "[Access]" line:
"GlobalSecurityAccess=405" (this security code is for "Full Access and Never ask me again setting")

Now your webica.ini file should look like this 


please note that you need to make this change for "IUSR_METRO" and "default user" under "Documents and Settings"
Then restart your performance center agent service and run your test; this should enable your transaction to pass on the remote 

Tuesday, August 28, 2012

View Citrix Vuser in LoadGenerator

Problem Statement: During scenario execution, you might be wondering is there a way where I can see why a certain VUser (Citrix protocol) is failing and why; which needs a kind of debug run to find a solution / fix to your code.

Solution: Actually there is a simple solution to the above mentioned problem. You can enable the citrix vuser view in controller command line (or in Performance Center) to view what the user is doing in replay window.

To do so all you need to do is to go to script group details and provide command line as shown in the screenshot below:


If you are using Performance Center, other than normal LR controller then you can use the command line feature in the design mode of the script as shown in the below screenshot:


One done start your scenario and you can see your virtual user replay in the load generator machine.
Please note that if you are running the Injector from PC then you need to stop the performance center agent service and start "magentproc.exe" manually under your user account so that you can view it properly. Otherwise this will be running under the PC user session and you will not be able to view the replay and waiting this thing to happen in your session.

Hope this small article helps you in resolving your issues.

Tuesday, July 3, 2012

Monitor Java app server via JMX and sitescope

Problem Statement: There was a need to monitor the JVM level stats from the application during performance testing other than normal system level stats.

Solution: Our target system was hosted on Tomcat 6.0 on a windows box (64-bit); to enable to monitor the JVM level params you can always enable JMX and monitor via Jconsole or VisualVM.

To enable JMX Settings on your application add the following lines to your startup script (or tomcat6w.exe in this case):

-Dcom.sun.management.jmxremote
-Dcom.sun.management.jmxremote.port="JMX Port"
-Dcom.sun.management.jmxremote.ssl=false
-Dcom.sun.management.jmxremote.authenticate=false

If your server is behind a firewall then you will not be able to access the JMX via JConsole or VisualVM; even though the telnet to JMX port shows that the port is running and accessible.

In that case you need to add another entry in the java params:
-Djava.rmi.server.hostname="IP Address of system"


Restart the tomcat service (or your java app server); now you should be able to access it through Jconsole or VisualVM on remote machines.


If you want to configure this on sitescope then you need to do is add a JMX monitor and provide the JMX URL to connect to that JVM as shown below:


service:jmx:rmi:///jndi/rmi://"Server Name":"JMX Port"/jmxrmi


Once this is done, select the appropriate counters to monitor in sitescope; once configured add it to your controller / PC scenario. This will enable you to store the values into your test results and analyse them later.


Hope this solution works for all.